
Impact
The IPU facilitates parliamentary diplomacy and empowers parliaments and parliamentarians to promote peace, democracy and sustainable development around the world.
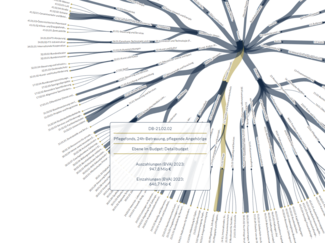
Visualization of the State’s budget, allowing website visitors to interact. Credit: Parliamentary Budget Office, Austria
The Austrian Parliamentary Budget Office (PBO) created an online Citizen’s Budget tool, helping MPs and the general public to visualize and explore the national budget. The PBO tells the story of how the tool was implemented and the response it received.
The idea of developing a budget visualization at the Austrian Parliamentary Budget Office (PBO) originated in 2019 in a plan of a much larger scope: to implement a Citizen’s Budget. After some initial research and conceptual work, the PBO started with a small but significant component of a full Citizen’s Budget. The aim was to create a website that would facilitate the easy exploration of the budget through interactive graphics for both members of parliament and the general public. This project is in line with the recent trend of using data visualization as a key tool for enhancing transparency and engagement in parliamentary work.
The data used for the visualizations primarily includes the current budget plan with its hierarchical structure (budget chapters, global budgets, detailed budgets) and the actual outcomes of previous years. This data can be explored for a single year, allowing users to quickly identify which parts of the budget have the highest expenditures and revenues. Alternatively, it can be viewed as a time series to identify changes in the budget over time. A separate interactive visualization highlights where the budget outcomes deviated most significantly from the plan. Other graphs provide monthly updates on budget execution and display important macroeconomic and government finance data and forecasts.
With no budget for external IT projects, the PBO developed the budget visualization in-house with the help of an intern, who proved to be highly capable and returned on several occasions to continue his work on the project. During the development process, which began in 2019, the intern was closely integrated within the PBO team, receiving steady and immediate feedback by the PBO staff. This collaboration was crucial to the project's success, helping to avoid dead ends and involving PBO staff in decisions regarding all essential details of the tool.
The first version of the visualization was published in 2020 within the context of the parliamentary discussion of the 2021 budget plan. Development continued in two phases until 2022, with a new interactive entry page and several improvements, such as tables accompanying most visualizations and dynamic links enabling direct access to specific views within a visualization.
Accessibility was a key consideration in developing the budget visualization but proved challenging due to the high level of interactivity of the graphics. The entry page, with all its interactive elements, is fully navigable using the keyboard, and all content shown on the entry page can be read aloud by screen readers. Even though the tool may not be able to achieve this level of accessibility for all individual parts of the visualization, adding alternative interactive tables for most visualizations was an important step in this direction.
The budget visualization was well-received, garnering positive feedback from members of parliament, experts and journalists. While interest in the tool peaks during the weeks following the submission of a new budget plan to Parliament, the PBO regularly links to specific views in its analyses published throughout the year. This provides an easy entry into the visualization, inviting users to continue exploring other parts of the budget.
For more information, visit the interactive visualization of the Austrian budget (available only in German).